Two categories of interpolation methods were analyzed: (1) the anomaly method, based on the calculation of differences between daily averages and hourly temperature values, and (2) the spatio-temporal Regression Kriging (RK) method, which quantifies at hourly scale the relationships between air temperature and selected auxiliary variables (LST SEVIRI and DEM-derived predictors). Figure 1 schematically describes the methodology applied in the evaluation of the selected interpolation methods.
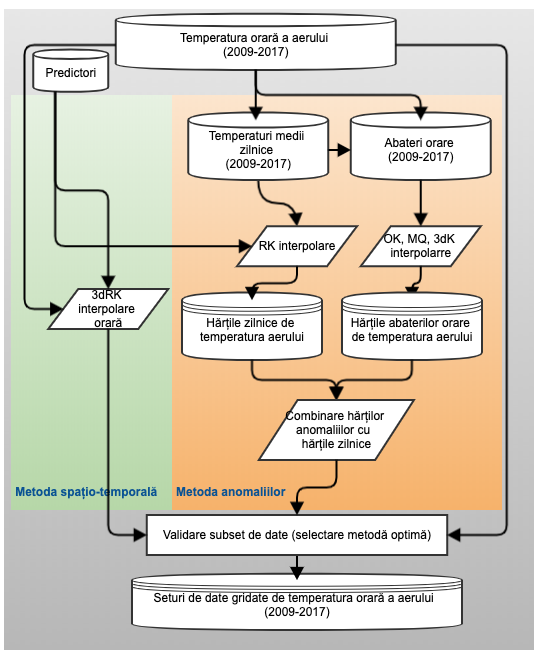
In order to select the optimal method for interpolating the temperature data, the dataset was split randomly by stations, and their corresponding time series, into an explicit training dataset used to calibrate the models (70% of the data), and an unseen test dataset used to evaluate the models’ performance at the locations of the stations (30% of the data). The model comparison was based on the following accuracy indicators: root mean squared error (RMSE), mean absolute error (MAE), root mean square error (RMSE), and Pearson’s correlation coefficient (CORR).
By analysing the indicators of estimation errors, a distinction is made between the methods based on daily averages and the 3dRK method, the latter obtaining the largest estimation errors, regardless of the season analysed (Table 1). Among the methods based on anomalies, according to the indicators calculated for each season, the best results are obtained by the RKa-OK method, especially in autumn and in the cold season. The RKa-MQ method obtains lower estimation errors than RKa-3DK, with better CORR, MAE and RMSE values in all analysed cases..
| Meth. | Corr | MAE | RMSE | |||||||||
| DJF | MAM | JJA | SON | DJF | MAM | JJA | SON | DJF | MAM | JJA | SON | |
| 3DRK | 0.91 | 0.936 | 0.911 | 0.95 | 1.984 | 1.723 | 1.846 | 1.734 | 2.623 | 2.292 | 2.465 | 2.319 |
| RKa-3DK | 0.95 | 0.936 | 0.899 | 0.954 | 1.409 | 1.658 | 1.924 | 1.554 | 1.959 | 2.304 | 2.609 | 2.218 |
| RKa-OK | 0.957 | 0.953 | 0.927 | 0.965 | 1.307 | 1.424 | 1.645 | 1.367 | 1.829 | 1.964 | 2.226 | 1.936 |
| RKa-MQ | 0.954 | 0.943 | 0.91 | 0.959 | 1.344 | 1.519 | 1.774 | 1.448 | 1.893 | 2.166 | 2.472 | 2.118 |
Because it was found that regardless of the accuracy indicator analyzed (CORR, RMSE, MAE), the smallest estimation errors are obtained by the RKa-OK method, it was decided to use this method for producing the hourly temperature grid data sets of air.